Interactive Dashboard with Second Language Statitics
26 Dec 2023 github repository
Quick demonstration of the dashboard
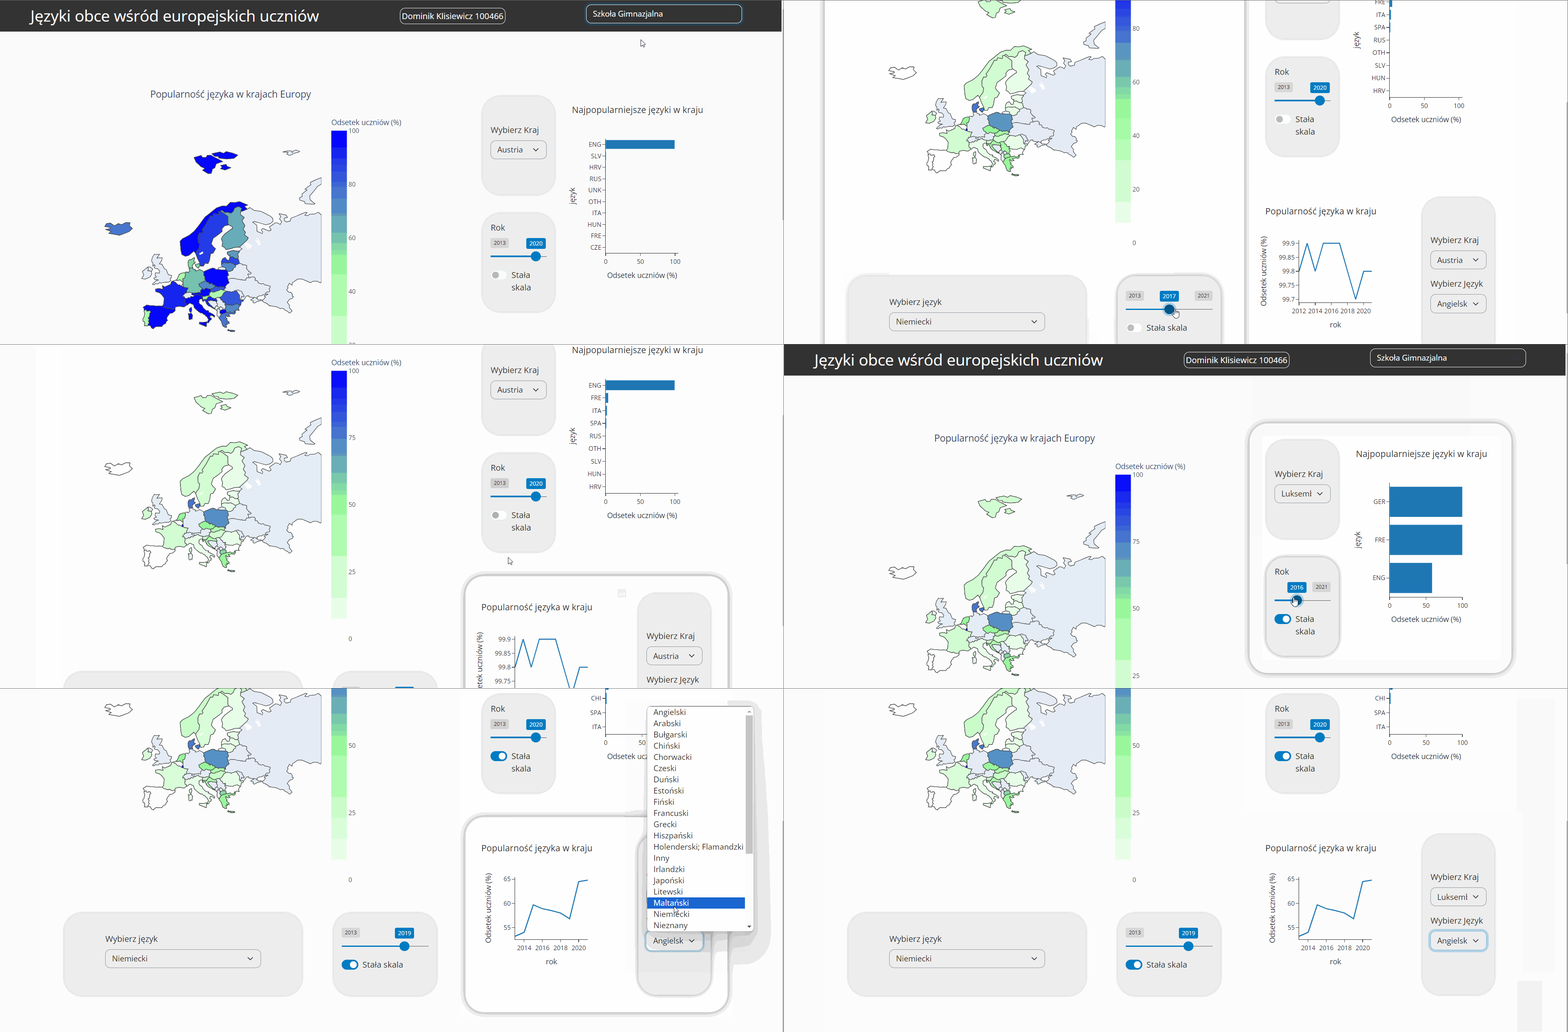
Caution: The link below is incredibly long because it contains all the code and data necessary to render the board, the link moves you to shinylive.io, serivice provided by Shiny Framework creators
You may play around with the dashboard by following this link
Authors
• Dominik Klisiewicz @DominikKlisiewicz
Project Overview
Python Shiny web app that gives the user detailed insight about language learning data in schools in the EU. The main window displays the popularity of a selected language in Europe on a map. The user may toggle the constant scale option in order to better understand changes over the years. The second section displays information about most popular languages in a given country in a given year. The last section of the dashboard shows the popularity of a given language in a given country in the entire period.